

Austin Housing Market 2025: New Construction vs. Resale Listings Data Analysis
Published | Posted by Dan Price
Austin’s Housing Market Trends: New Construction vs. Resale Listings in 2025
The housing market in Austin has been a topic of interest for many in 2025, with a common belief that new construction is driving the increase in available homes. However, a detailed look at the data from March 6, 2025, to June 4, 2025, reveals a different story. By examining active listings, pending listings, and the Activity Index for both new construction and resale properties, we can better understand the real dynamics of Austin's residential real estate market during this three-month period. This data, sourced from Team Price Real Estate, provides a clear picture of how inventory and sales activity have shifted.
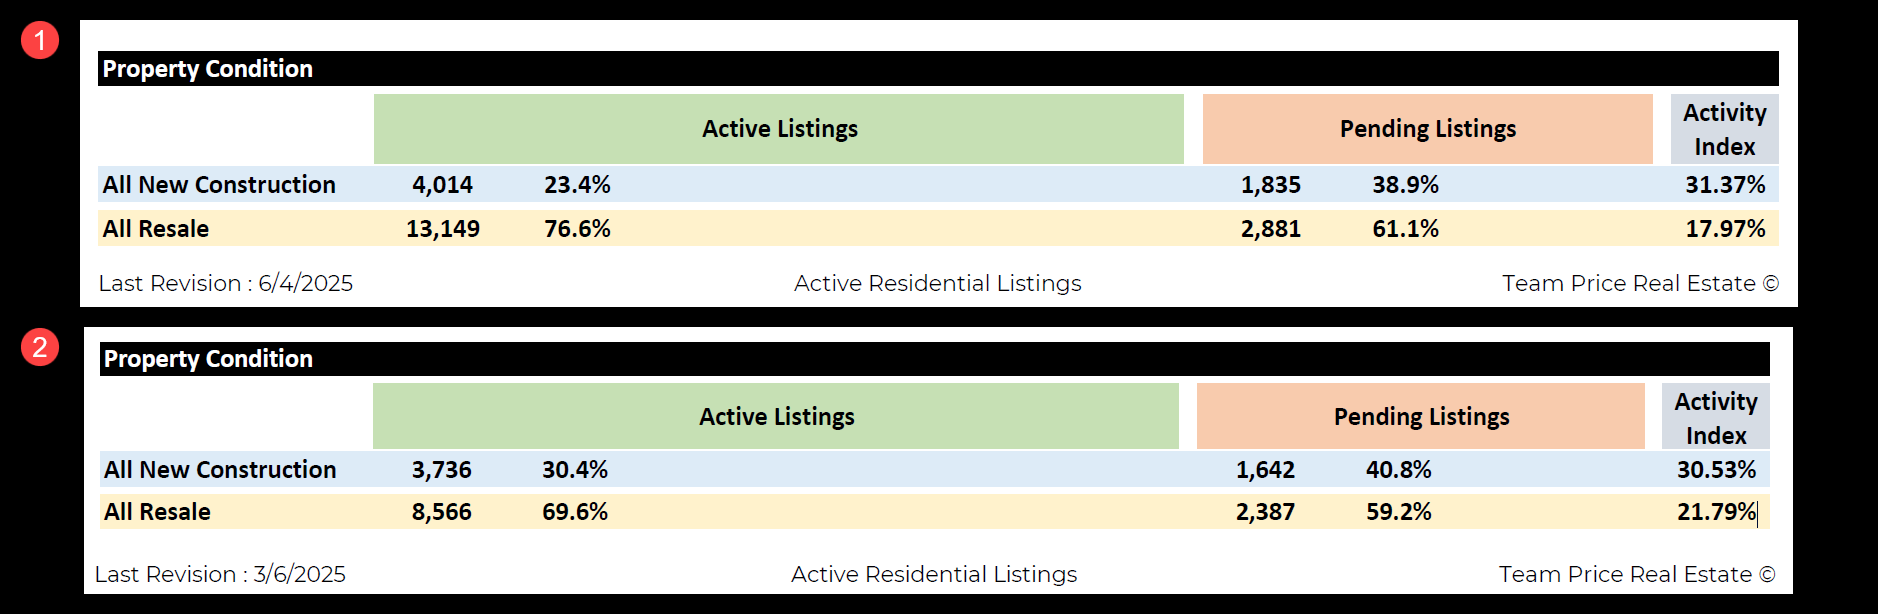
On March 6, 2025, Austin had a total of 12,302 active residential listings. Of these, 3,736 were categorized as "All New Construction," making up 30.4% of the total, while 8,566 were "All Resale," accounting for 69.6%. Fast forward to June 4, 2025, and the total active listings grew to 17,163—an increase of 4,861 homes. During this period, new construction listings rose to 4,014, a modest increase of 278 homes, bringing their share down to 23.4% of the total. In contrast, resale listings surged to 13,149, an increase of 4,583 homes, raising their share to 76.6%. This means resale properties accounted for 94.3% of the total inventory growth, while new construction contributed just 5.7%. This data challenges the idea that new construction is the primary driver of Austin’s increasing housing inventory, showing instead that resale homes are leading the charge.
Looking at the percentage increase in active listings over these three months provides further insight. New construction active listings grew by 7.44%, going from 3,736 to 4,014. Resale active listings, however, saw a much larger increase of 53.50%, jumping from 8,566 to 13,149. This significant difference highlights how resale homes are flooding the market at a much faster rate than new construction. When we examine pending listings—those under contract and moving toward a sale—the trend continues. On March 6, new construction had 1,642 pending listings, which increased to 1,835 by June 4, a rise of 11.75%. Resale pending listings grew from 2,387 to 2,881, a 20.69% increase. While both categories saw growth in pending sales, resale properties again showed a stronger upward trend, indicating higher buyer interest relative to their starting point.
Another key metric to understand market performance is the Activity Index, which measures the proportion of listings that are pending out of the total (active plus pending). A higher Activity Index suggests a stronger market, as more homes are moving toward a sale. On March 6, 2025, the Activity Index for new construction was 30.53%, calculated as 1,642 pending listings divided by 5,378 total listings (3,736 active plus 1,642 pending). By June 4, this improved slightly to 31.37%, with 1,835 pending listings out of 5,849 total (4,014 active plus 1,835 pending). For resale, the Activity Index on March 6 was 21.79%, based on 2,387 pending listings out of 10,953 total (8,566 active plus 2,387 pending). However, by June 4, it dropped to 17.97%, with 2,881 pending listings out of 16,030 total (13,149 active plus 2,881 pending). This represents a 0.84 percentage point increase for new construction and a 3.82 percentage point decrease for resale over the three months. The improvement in the Activity Index for new construction suggests that a larger share of these homes is moving toward sales, while the decline for resale indicates a slowdown in sales activity relative to the growing inventory.
Breaking down the Activity Index further, we see that on June 4, 2025, new construction’s index of 31.37% was significantly higher than resale’s 17.97%. This gap underscores that new construction homes are performing better in terms of sales activity, as a greater proportion of them are under contract compared to resale homes. Over the three-month period, new construction’s slight improvement in the Activity Index (from 30.53% to 31.37%) contrasts with resale’s notable decline (from 21.79% to 17.97%), further highlighting the stronger market performance of new construction despite its smaller contribution to inventory growth.
In summary, the data from March 6 to June 4, 2025, shows that Austin’s housing market inventory growth is primarily driven by resale listings, which increased by 53.50% compared to a 7.44% increase for new construction. Resale also saw a higher percentage increase in pending listings at 20.69%, compared to 11.75% for new construction. However, when it comes to market performance, new construction is stronger, with an Activity Index that improved to 31.37% while resale’s dropped to 17.97%. These trends provide a comprehensive view of Austin’s housing market, showing that while resale dominates inventory growth, new construction homes are more likely to attract buyers and move toward a sale.
FAQ Section
1. What is the difference between new construction and resale homes in Austin’s 2025 housing market?
New construction homes are newly built properties, often categorized as "New Construction," "Under Construction," or "To Be Built," while resale homes are previously owned properties being sold again. In Austin’s 2025 market, data from March 6 to June 4 shows that new construction active listings grew from 3,736 to 4,014, a 7.44% increase, while resale active listings surged from 8,566 to 13,149, a 53.50% increase. Pending listings for new construction rose by 11.75% (from 1,642 to 1,835), compared to a 20.69% increase for resale (from 2,387 to 2,881). However, the Activity Index, which measures sales activity, was higher for new construction at 31.37% on June 4, compared to 17.97% for resale, indicating that new construction homes were more likely to move toward a sale despite slower inventory growth.
2. How has the Austin housing market inventory changed in 2025?
Between March 6 and June 4, 2025, Austin’s total active residential listings increased from 12,302 to 17,163, a growth of 4,861 homes. Resale listings drove this increase, growing by 4,583 homes (from 8,566 to 13,149), which accounted for 94.3% of the total increase. New construction listings, on the other hand, only increased by 278 homes (from 3,736 to 4,014), contributing just 5.7% to the growth. The share of new construction listings dropped from 30.4% to 23.4% of the total, while resale’s share rose from 69.6% to 76.6%. This data shows that resale properties, not new construction, were the primary driver of inventory growth in Austin during this period.
3. Are new construction homes selling faster than resale homes in Austin in 2025?
Yes, new construction homes are selling faster than resale homes in Austin in 2025, based on the Activity Index. On June 4, 2025, new construction had an Activity Index of 31.37%, meaning 31.37% of its total listings (active plus pending) were pending, compared to 17.97% for resale. Over the three months from March 6 to June 4, new construction’s Activity Index improved from 30.53% to 31.37%, a 0.84 percentage point increase, while resale’s dropped from 21.79% to 17.97%, a 3.82 percentage point decrease. This indicates that new construction homes are more likely to move toward a sale, reflecting stronger buyer demand relative to the available inventory.
4. What does the Activity Index tell us about the Austin housing market in 2025?
The Activity Index, calculated as pending listings divided by (active plus pending listings), shows the proportion of homes moving toward a sale, reflecting market strength. In Austin on June 4, 2025, new construction’s Activity Index was 31.37%, based on 1,835 pending listings out of 5,849 total, while resale’s was 17.97%, with 2,881 pending listings out of 16,030 total. From March 6 to June 4, new construction’s index improved by 0.84 percentage points (from 30.53% to 31.37%), indicating a slight increase in sales activity. Resale’s index, however, declined by 3.82 percentage points (from 21.79% to 17.97%), suggesting a slowdown in sales relative to its growing inventory. This metric highlights that new construction is performing better in terms of sales activity despite resale’s dominance in inventory growth.
5. Why is the Austin housing market inventory growing in 2025?
Austin’s housing market inventory grew by 4,861 active listings between March 6 and June 4, 2025, from 12,302 to 17,163. This growth was primarily driven by resale listings, which increased by 4,583 homes (a 53.50% rise from 8,566 to 13,149), accounting for 94.3% of the total increase. New construction listings grew by only 278 homes (a 7.44% rise from 3,736 to 4,014), contributing just 5.7% to the growth. The data shows that the surge in resale listings, rather than new construction, is the main reason for the inventory increase. Additionally, the slower growth in new construction’s Activity Index (from 30.53% to 31.37%) compared to the decline in resale’s (from 21.79% to 17.97%) suggests that resale homes are lingering on the market longer, further contributing to the inventory buildup.
Related Articles
Keep reading other bits of knowledge from our team.
Request Info
Have a question about this article or want to learn more?
