Austin Housing Market Sees Over 50% of Listings Drop Prices – May 2025
Published | Posted by Dan Price
Austin-Area Real Estate Market Sees Widespread Price Reductions in May 2025
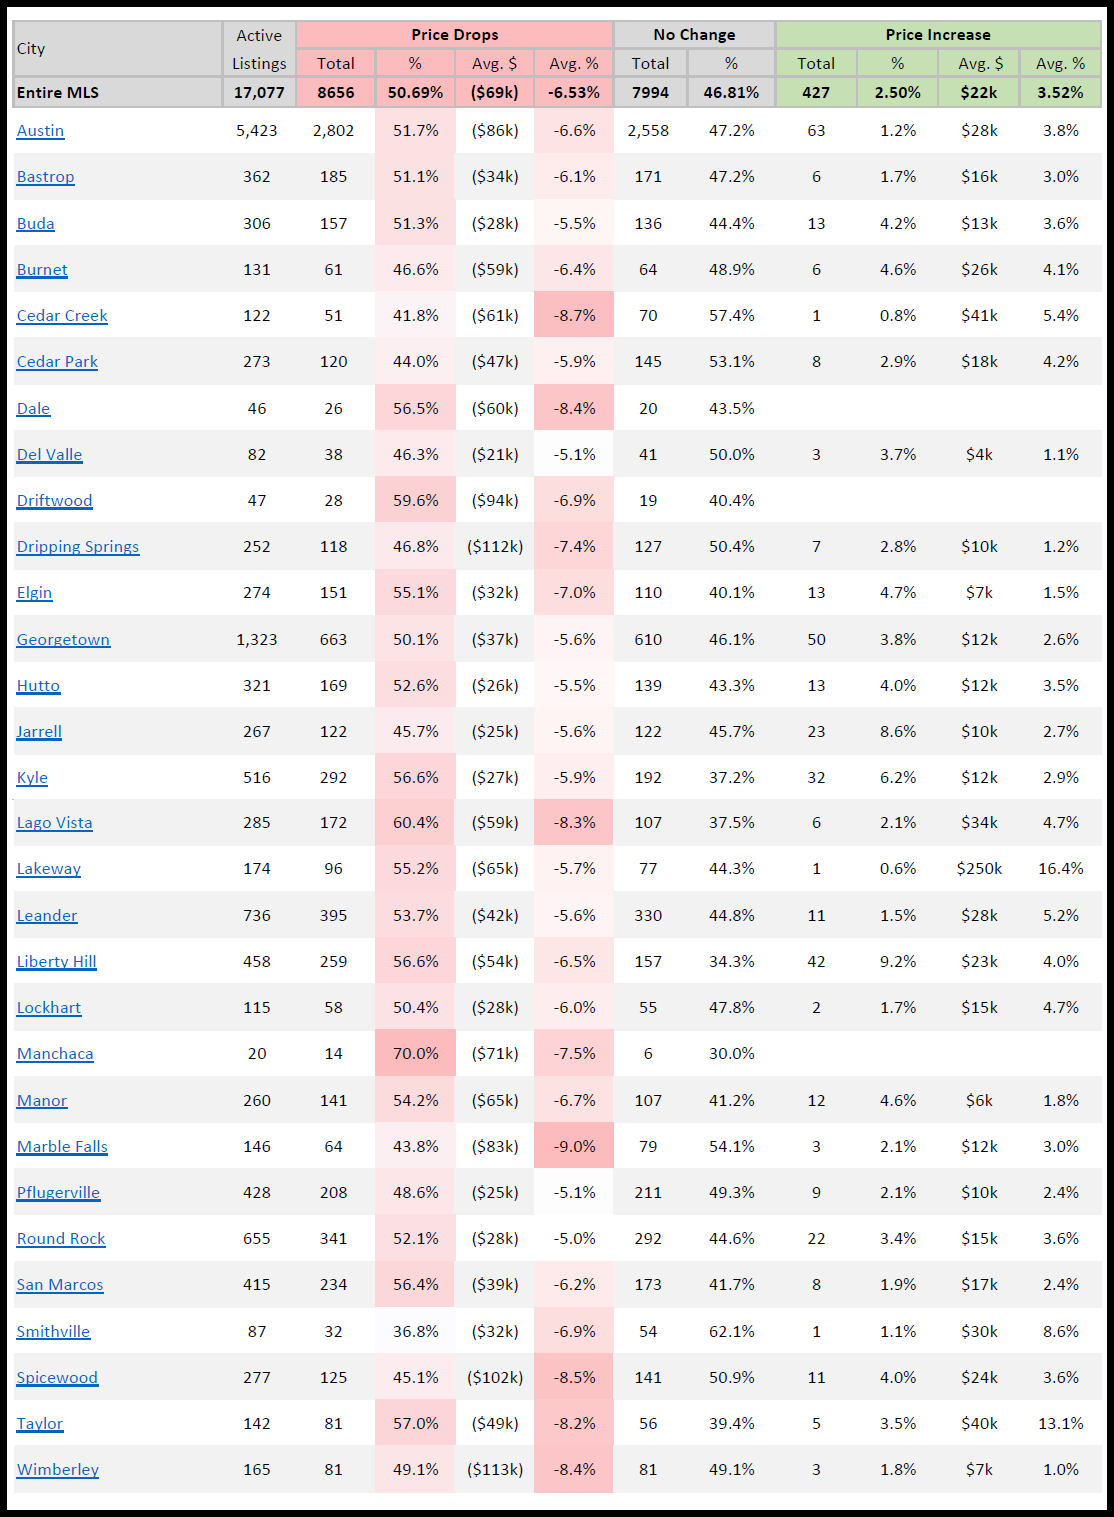
As of May 19, 2025, a growing number of sellers across the Austin-area MLS are lowering their listing prices. Out of 17,077 active residential listings, 8,656 have seen price drops. This means over half of all listings—50.69%—have reduced their original asking price. The average price cut across the MLS is $69,000, which represents a 6.53% decrease.
In Austin proper, the trend closely mirrors the broader market. With 5,423 active listings, 2,802 properties have experienced price reductions. The average drop here is $86,000, or 6.6% off the original price. Round Rock, another major city in the metro area, has 655 active listings, with 341 having dropped their prices. However, Round Rock shows the lowest average percentage drop at just 5.0%, or $28,000 per listing.
Marble Falls currently holds the distinction of having the highest average percentage drop in the region at 9.0%. Although only 43.8% of listings in Marble Falls have dropped in price, the average reduction is steep—$83,000 per home. Other cities with notable price adjustments include Spicewood, where 45.1% of listings show an average drop of $102,000 or 8.5%, and Wimberley, where 49.1% of listings have seen an average decrease of $113,000 or 8.4%.
The pricing shifts are widespread, extending beyond just a few markets. Kyle, Elgin, Taylor, and Liberty Hill each report more than half of their active listings with price reductions. For example, Kyle shows a 56.6% reduction rate, with an average cut of $27,000 or 5.9%, while Taylor has a similar 57.0% reduction rate and a sharper drop of $49,000 or 8.2%.
Some areas like Dale and Manchaca report smaller sample sizes but notable statistics. Dale has a price reduction rate of 56.5%, with an average drop of $60,000 or 8.4%. Manchaca leads all cities in price reduction frequency, with 70% of listings having dropped in price and an average reduction of $71,000 or 7.5%.
While price drops dominate, 2.5% of all listings across the MLS have actually increased in price. These increases are far smaller, averaging $22,000 or a 3.52% bump. Cities like Lakeway, although only showing a 0.6% increase rate, reported the highest average price increase at $250,000 or 16.4%.
These figures reflect an increasingly competitive housing market where sellers are adjusting their expectations amid shifting buyer behavior and longer days on market. The data reveals localized variation across the Austin metro, but the broader trend remains clear: price reductions are widespread and significant, with most areas averaging 5% to 9% off original asking prices.
What percentage of homes in the Austin MLS have dropped their prices in May 2025, and what does that indicate about the market?
According to the latest data from May 19, 2025, 8,656 out of 17,077 active residential listings in the Austin-area MLS have had price reductions. This represents 50.69% of all listings. Such a high percentage of price drops signals a clear market correction and growing pressure on sellers to adjust pricing expectations. The average reduction across the MLS is $69,000, or 6.53%. This level of downward adjustment is not typical in a seller's market and instead reflects a shift toward more buyer-friendly conditions. Sellers are competing for limited buyer attention amid elevated inventory levels, rising days on market, and affordability concerns, all of which are contributing to price softening throughout the region.
Which Austin-area city experienced the most significant percentage drop in listing prices, and how much are prices falling there on average?
Marble Falls reported the most significant percentage decline in average listing prices, with an average price drop of 9.0% as of mid-May 2025. This equates to an average reduction of $83,000 per listing. Although only 43.8% of active listings in Marble Falls had price reductions, those that did were notably deep. This suggests that while fewer sellers are reducing prices in this specific market compared to others, the ones who do are making larger-than-average adjustments. This could be due to higher original list prices, slower absorption, or more resistance from buyers at the current valuation levels. In contrast, Round Rock had one of the lowest average percentage drops at 5.0%, which highlights the variability in pricing behavior across different submarkets within the Austin metro.
Are any listings in the Austin MLS increasing in price during this period, and what does that suggest?
Yes, while the majority of active listings are reducing their prices, there is a small subset that has seen price increases. Specifically, 2.5% of listings—or 427 properties—have raised their asking prices in May 2025. These increases average $22,000, which reflects a 3.52% gain from their original listing prices. Although limited, these upward adjustments often indicate seller confidence in premium product segments, unique location advantages, or recent renovations that support a revised value proposition. One standout is Lakeway, where the average price increase for those few listings was an eye-catching $250,000, or 16.4%, albeit from only one property. Still, the overwhelming trend across the Austin market is downward pricing pressure, making these increases the exception rather than the rule. Sellers who raise prices typically do so with specific leverage—such as multiple offers, limited inventory in their micro-market, or delayed listing after improvements—not because of broad market strength.