Austin New Construction Homes Show Widespread Price Drops
September 25, 2025 – Austin, TX
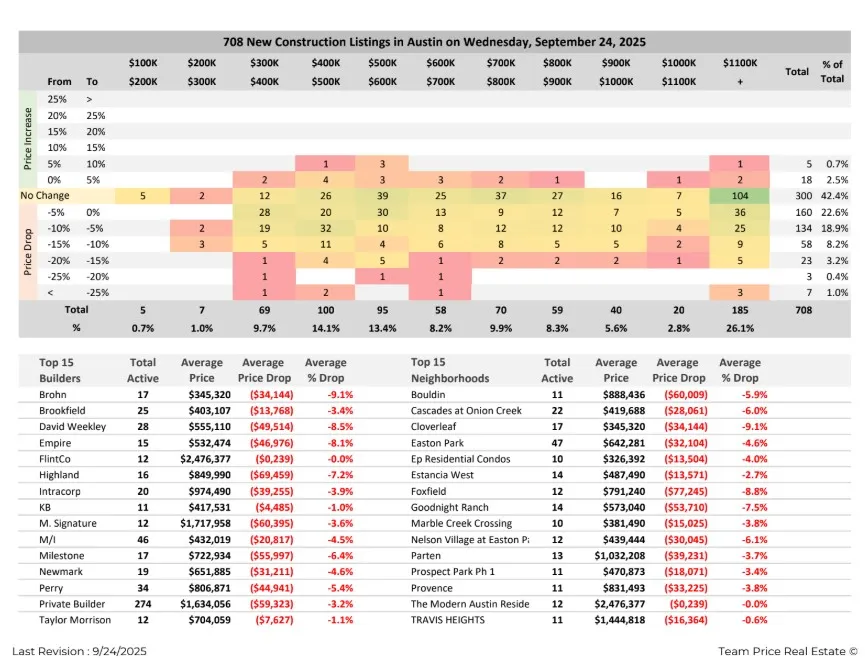
Austin’s new construction housing market is undergoing a noticeable shift, with price reductions spreading across builders and neighborhoods. A recent report analyzing 708 active new construction listings reveals that a large share of homes are being discounted, while many builders are also offering financing incentives that allow buyers to secure mortgage rates below the standard market level.
Price Reductions Are Taking Hold
The numbers show that price adjustments are becoming a common feature in the market. Out of all active new construction listings, 34.9 percent recorded price drops, while 22.6 percent held steady with no change. Interestingly, 42.4 percent of homes still showed price increases, highlighting the mixed conditions across different segments of the market.
Among the homes that decreased in price, the reductions were significant in many cases. Nearly one out of five homes saw prices fall between five and ten percent, while another 8.2 percent dropped between ten and fifteen percent. Some homes moved even further, with 3.2 percent dropping between fifteen and twenty percent, and 1.0 percent falling by more than twenty-five percent. These figures demonstrate that discounts are not isolated to a single price bracket but spread across a range of homes, from entry-level to higher-end listings.
Builders Adjusting to the Market
Price cuts were not limited to individual homes; they were visible across major builders as well. For example, Brohn Homes averaged a nine percent reduction, bringing their average price to $345,320. David Weekley Homes reported an 8.5 percent drop, while Empire Communities lowered prices by 8.1 percent. Highland Homes reduced prices by 7.2 percent, and Milestone Homes cut 6.4 percent on average.
Some builders reported only modest adjustments. KB Homes decreased prices by about one percent, while Taylor Morrison saw a similar reduction of 1.1 percent. Others, such as FlintCo and The Modern Austin Residences, showed no overall price change during the reporting period.
Neighborhoods Seeing Discounts
Discounts are also visible at the neighborhood level, showing that both new communities and established areas are adjusting. In Cloverleaf, prices averaged a 9.1 percent reduction, while Goodnight Ranch recorded a 7.5 percent decline. Foxfield homes decreased by 8.8 percent, and Cascades at Onion Creek dropped by six percent.
Even in higher-priced areas, reductions were present. Easton Park showed a 4.6 percent decrease, Provence dropped by 3.8 percent, and Travis Heights reported a 0.6 percent decline, bringing the average price there to more than $1.4 million. The data indicates that both affordable and luxury markets are being impacted by current conditions.
Incentives Beyond Price
In addition to lowering listing prices, many builders are also offering special financing incentives. These programs allow some buyers to secure interest rates below the current standard market rate, adding another dimension of affordability for those purchasing new construction.
The Current Market Snapshot
As of September 24, 2025, the data shows that Austin’s new construction market is shifting. With 708 active listings and a substantial share of homes showing price reductions, both builders and neighborhoods are making adjustments. For buyers, the combination of lower prices and financing incentives marks an important development in Austin’s housing market.


