Understanding Market Trends Through the Demand Momentum Index (DMI)
Published | Posted by Robert Foradory
Understanding Market Trends Through the Demand Momentum Index (DMI)
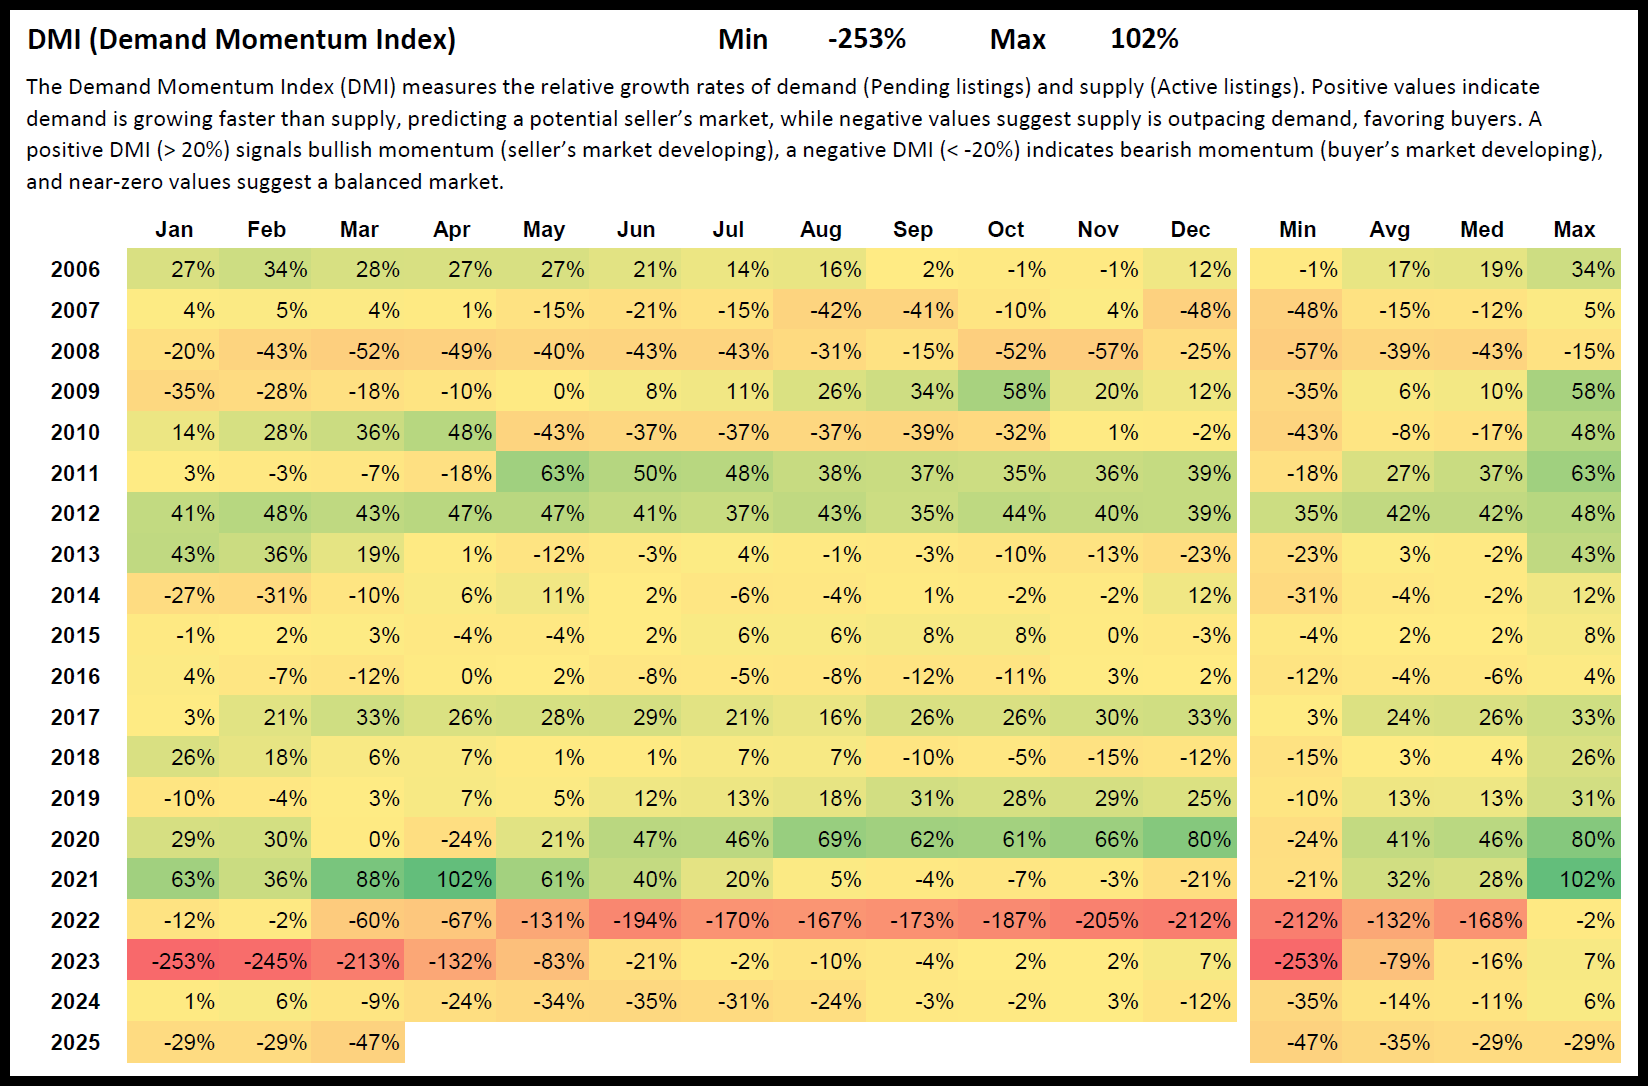
The real estate market constantly shifts between favoring buyers and sellers, making it essential to track key performance indicators. One such critical metric is the Demand Momentum Index (DMI), which measures the relative growth of demand, represented by pending listings, against supply, represented by active listings. A positive DMI indicates demand is outpacing supply, leading to a seller’s market, while a negative DMI means supply is growing faster, signaling a buyer’s market.
Looking at historical data, the DMI has seen extreme fluctuations over the past two decades, reflecting major economic events, policy changes, and market corrections. In the early years of this dataset, 2006 showed a positive start, with the DMI peaking at 34% in February, suggesting a strong seller’s market. However, by 2007, the index began to decline, hitting a low of -48% in December, reflecting the onset of the housing crisis. The downward trend continued in 2008, with the DMI dropping as low as -57%, showing a deep buyer’s market driven by economic instability.
As the market recovered, 2009 showed a remarkable turnaround, with the DMI rebounding from -35% in January to a high of 58% in October. This signaled a shift toward a strong seller’s market, fueled by government intervention and improving economic conditions. The following years saw continued volatility, with 2010 experiencing another major dip to -43% in May before recovering to 48% in April.
Between 2011 and 2015, the DMI remained relatively stable, fluctuating between moderate highs and lows. In 2012, the market saw a strong seller’s trend, with a peak DMI of 48%. However, 2013 brought increased volatility, with numbers ranging from -23% to 43%, reflecting uncertainty. By 2014 and 2015, the market had stabilized with a less dramatic range of -31% to 12% and -4% to 8%, respectively.
The period from 2016 to 2019 marked a gradual market strengthening. The DMI reached 33% in December 2017, showing seller dominance. In 2019, demand and supply appeared more balanced, with the index averaging 13%, indicating neither a strong buyer’s nor a seller’s market.
2020 brought unprecedented shifts due to the COVID-19 pandemic. The year started with a strong DMI of 29% in January, but April saw a sharp decline to -24% as lockdowns disrupted transactions. However, as the market adapted, demand surged, with the DMI reaching an all-time high of 80% in December, reflecting historically low inventory and soaring buyer interest.
In 2021, the seller’s market persisted, peaking at 102% in April before beginning to cool in the latter half of the year. The downward trend became evident in 2022, with the DMI plummeting to -212% in December, signaling one of the strongest buyer’s markets in recent history.
The market correction continued into 2023, though signs of stabilization emerged, with the index recovering from -253% in January to 7% by December. The latest data from 2024 shows a mixed trend, with the DMI fluctuating between -35% and 6%, indicating uncertainty in market momentum.
Forecasts for 2025 suggest a continued correction, with the DMI trending negative in the first half of the year. This could mean an ongoing buyer-friendly market, depending on inventory levels and economic conditions.
Tracking the DMI offers valuable insights into market cycles, helping investors and buyers make informed decisions. Whether navigating a buyer’s or seller’s market, understanding supply and demand trends is key to strategic real estate investments.