Inventory Growth and Market Balance
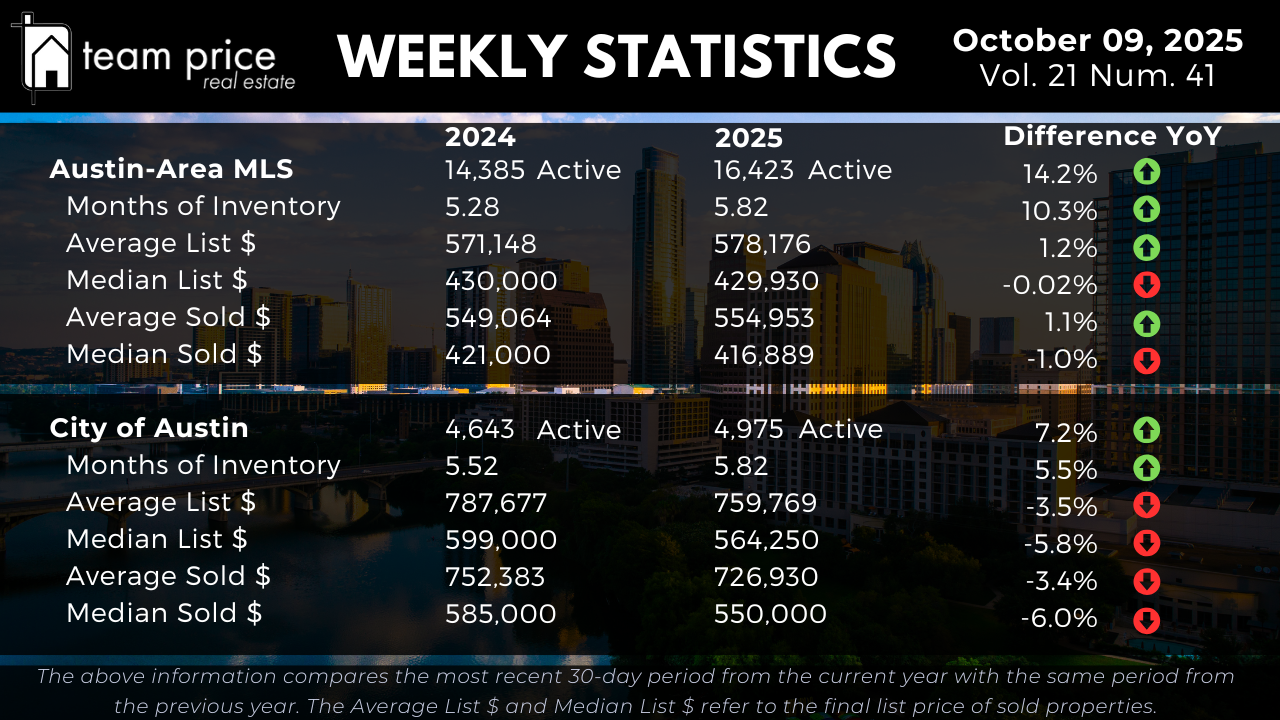
Active residential listings across the Austin area continue to climb, confirming the city’s ongoing shift toward a more balanced housing market. As of early October 2025, there are 16,423 active listings, up 14.2% from 14,385 one year ago. Compared to last week’s 16,375 listings, inventory has edged slightly higher, showing that supply continues to expand despite seasonal slowing. The Months of Inventory figure rose from 5.28 to 5.82, marking a 10.3% increase and reinforcing that homes are staying on the market longer as absorption slows. Buyers are gaining leverage, and sellers are facing more competition as the fall season unfolds.
Inside the City of Austin, inventory growth has been somewhat more restrained but still meaningful. Active listings have climbed 7.2% year over year, moving from 4,643 in 2024 to 4,975 today. The city’s Months of Inventory also increased, rising from 5.52 to 5.82, a 5.5% gain. Week over week, Austin’s inventory held relatively steady, signaling that while supply remains elevated compared to last year, the surge of new listings seen earlier in the summer has tapered off. The overall takeaway: buyers now enjoy more choices, while sellers must adjust expectations and pricing strategies to compete effectively.
Pricing Stability Across the Region
Despite the substantial rise in inventory, prices across the Austin area remain remarkably steady. The average list price for active homes across the region stands at $578,176, up 1.2% from $571,148 last year. The median list price shows virtually no change, dipping just 0.02% to $429,930. On the closed sales side, the average sold price increased 1.1% year over year, from $549,064 to $554,953, while the median sold price slipped 1.0%, moving from $421,000 to $416,889.
Week over week, these values have remained largely stable, underscoring that the market has reached a phase of price equilibrium. Even with rising inventory, price erosion has been minimal, a sign that underlying demand continues to support current values. For most sellers, price adjustments are now driven more by property condition, location, and time on market rather than broad regional pressure. For buyers, this creates an environment of predictability—values are no longer climbing rapidly, but neither are they collapsing.
Pricing Trends in the City of Austin
Within the City of Austin, price trends show a sharper correction compared to the surrounding metro area. The average list price has fallen 3.5% year over year, dropping from $787,677 to $759,769, while the median list price is down 5.8%, from $599,000 to $564,250. Closed sales follow the same trajectory: the average sold price decreased 3.4%, from $752,383 to $726,930, and the median sold price fell 6.0%, sliding from $585,000 to $550,000.
Compared to last week, city prices are holding steady at these lower levels, suggesting that the bulk of the correction has already occurred. The declines are most visible in the mid-price segments, where affordability challenges and elevated interest rates have softened buyer demand. While luxury inventory continues to dominate the listing pool, the broader urban market reflects a normalization phase rather than a downturn. Buyers now hold stronger negotiating power, but sellers who price accurately can still attract serious offers.
Negotiation and Buyer Leverage
Negotiation remains a defining feature of the Austin housing market this fall. As of early October, 69.22% of closed sales have transacted below list price, up from 65.93% last month. Meanwhile, 18.41% of homes sold at list price, down from 21.90%, and 12.37% sold over asking, nearly unchanged from last month’s 12.18%. For comparison, in July 2024, more than 13% of homes were selling above list—evidence that the market’s competitive edge has cooled.
The average sold-to-list price ratio across the Austin area now stands at 97.17%, reflecting that most sellers are accepting modest price concessions to secure a buyer. These numbers reinforce that buyers have more control during negotiations, often achieving favorable terms or closing cost credits that were rare just two years ago. Sellers who adapt to this dynamic—by pricing realistically and adjusting early if showings stall—are still closing successfully, but overpricing remains a costly mistake.
Regional and ZIP Code Variations
Market performance remains highly uneven across Central Texas. Out of 30 tracked cities, 17 posted month-over-month price increases (57%), while 13 recorded declines (43%). Year over year, the split tilts slightly negative, with 14 cities showing gains and 16 showing declines. None of the tracked cities are above their 12-month peak, confirming that the market-wide recalibration continues to hold.
At the ZIP code level, trends mirror the city-level split. Out of 75 tracked ZIP codes, 40 (53%) showed month-over-month gains, while 32 (43%) posted declines. On a year-over-year basis, 35 ZIP codes saw price increases and 40 reported decreases. Only one ZIP code across the Austin region remains above its 12-month peak, indicating that while local rebounds occur, most neighborhoods are still trading below their prior highs.
This dispersion highlights how localized Austin’s market has become. Areas with stable employment bases, new infrastructure, or constrained new construction—such as parts of Georgetown, Buda, and Leander—are faring better than outer-ring markets still working through excess inventory and longer selling cycles.
Prices Relative to Peak Levels
When compared to market peaks from 2022 and 2023, current prices remain well below their highs. Across the Austin area, the average list price has dropped 6.7% from its March 2023 peak, while the median list price sits 15.9% below its May 2022 high. The average sold price is down 10.5%, and the median sold price has declined 17.8% from peak values. On a price-per-square-foot basis, both average and median values remain 21–23% below their highs from 2022.
Inside the City of Austin, the same trend holds, though recent luxury listings have kept averages slightly elevated. The average list price has fallen 8.4% since its September 2025 peak, while the median list price is 3.7% below its 2022 high. The average sold price is 8.1% lower than its May 2022 peak, and the median sold price has declined 17.0%. On a per-square-foot basis, both average and median values are 23–29% below their highs.
These comparisons illustrate that while the Austin market has corrected meaningfully since its pandemic-era surge, pricing has now stabilized at sustainable levels, roughly 15–25% below peak across most metrics.
Market Outlook
As of October 2025, the Austin housing market continues to show clear signs of balance and stabilization. Inventory levels remain higher year over year, absorption has slowed, and most homes are selling below their initial list prices. Across the region, average and median prices are largely flat compared to last year, while within the city, values are still adjusting downward.
For buyers, this environment offers opportunity: more listings to choose from, moderate price stability, and greater negotiating power. For sellers, success depends on pricing strategically, understanding local competition, and staying responsive to buyer feedback. For investors, this market presents a window for disciplined acquisitions, with current prices averaging 15–25% below peak levels, setting the stage for long-term value recovery.
The days of runaway appreciation are behind us—for now, Austin’s housing market is defined by balance, patience, and strategic positioning as both buyers and sellers adapt to a more normalized real estate landscape.