Market Overview
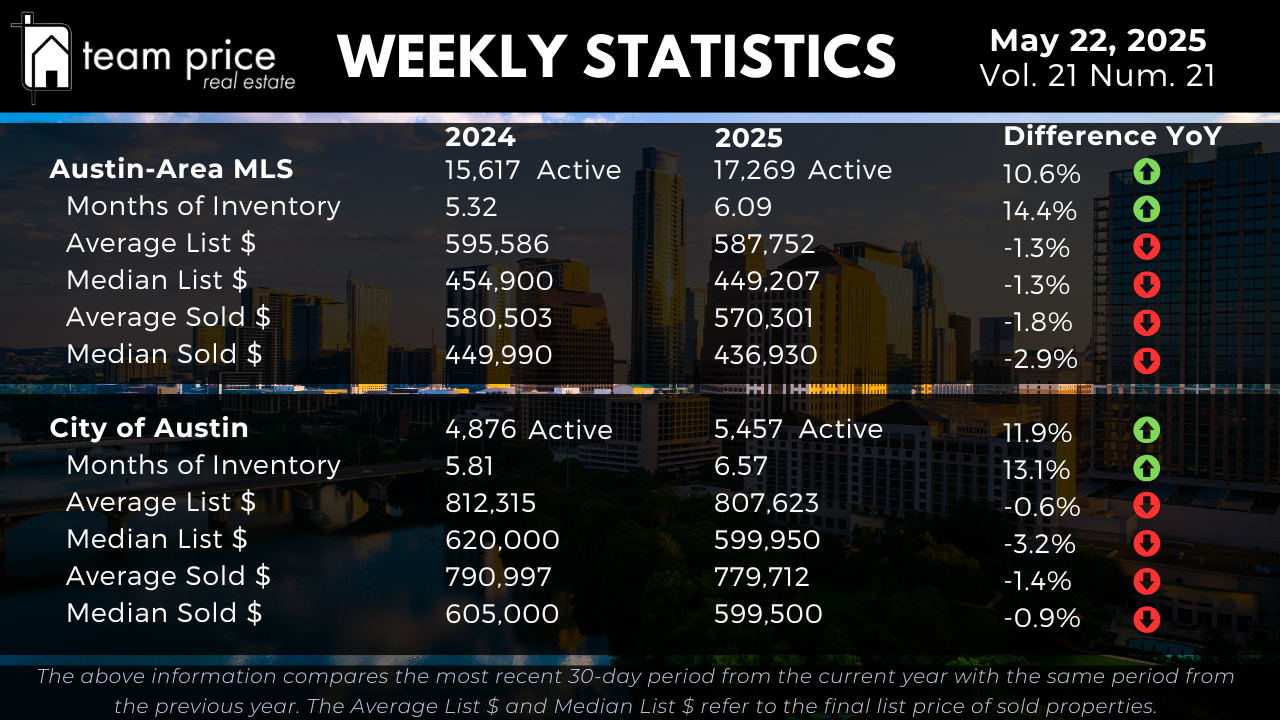
As of May 21, 2025, the Austin-area MLS reports 17,269 active listings, a 10.6% increase from 15,617 active listings in May 2024. The Months of Inventory has also expanded significantly, rising from 5.32 months to 6.09—a 14.4% increase, representing approximately a 1.1x year-over-year increase. This continued growth in inventory reflects sustained market pressure, giving buyers increased leverage and signaling ongoing price normalization. In the City of Austin, active listings have grown 11.9%, from 4,876 to 5,457, while Months of Inventory has climbed from 5.81 to 6.57 months, a 13.1% increase, also consistent with the regional trend of a slowing market.
Pricing Dynamics in Austin Real Estate
Home prices across the Austin region are showing modest year-over-year declines. In the Austin-area MLS, the average active list price has dropped 1.3%, from $595,586 to $587,752. The average sold price has declined 1.8%, from $580,503 to $570,301, and the median sold price is down 2.9%, from $449,990 to $436,930. The median active list price also declined 1.3%, from $454,900 to $449,207.
In the City of Austin, price movements have been slightly more stable. The average active list price is down 0.6%, from $812,315 to $807,623, and the median active list price fell 3.2%, from $620,000 to $599,950. On the sold side, the average sold price decreased 1.4%, from $790,997 to $779,712, and the median sold price declined 0.9%, from $605,000 to $599,500. These changes suggest persistent pricing pressure, especially in the lower and middle tiers of the market.
City and Regional Dynamics
Team Price Real Estate monitors 30 Central Texas cities, revealing a highly localized market shift. This month, 15 cities (50%) recorded month-over-month price increases, while 14 cities (47%) experienced declines. Year-over-year, only 12 cities (40%) posted gains, with 18 (60%) showing price decreases. Notably, none of the 30 cities remain priced above their 12-month peak values—100% are currently below. Among the 75 tracked zip codes, 39 (52%) saw monthly price gains, while 33 (44%) declined. Year-over-year, 28 zip codes (37%) appreciated, while 47 (63%) declined. Only 2 zip codes are still priced above their 12-month peak, underscoring widespread price compression.
Sales vs. List Price Analysis
As of May 2025, 64.20% of homes sold below list price, up slightly from 62.86% last month, but still down from 66.46% in April. Meanwhile, 21.50% of homes sold at list price, nearly identical to April’s 21.91%. Just 14.30% sold above list price, a dip from 15.22% in April and 16.81% a year ago. The average sold-to-list price ratio now sits at 97.59%, suggesting that although buyers are still negotiating, sellers continue to retain most of their list price in final sale figures.
Peak Value Analysis: Austin-Area MLS
The Austin-area MLS remains notably below its peak pricing benchmarks. The average list price hit a high of $733,290 in April 2025 but has since dropped 7.9% to $674,736. The median list price has fallen 8.3%, from its May 2022 peak of $539,900 to $495,000. The average sold price has slipped 0.9% from $664,515 to $658,410, while the median sold price is down 9.7%, from $538,000 to $486,000. Price per square foot metrics show even steeper declines: the average has dropped 14.2%, from $324 to $278, and the median is down 17.1%, from $280 to $232.
Peak Value Analysis: City of Austin
In the City of Austin, the average list price peaked at $975,300 in April 2025 and has declined 11.2% to $866,386. The median list price also fell 11.6%, from $677,450 to $599,000. However, the average sold price remains near its all-time high of $895,687, reflecting continued strength in higher-end sales. That said, other metrics show a clear decline: the median sold price has dropped 5.5%, from $680,000 to $642,500. The average sold price per square foot has fallen 16.3%, from $442 to $370, and the median is down 13.2%, from $393 to $341. These indicators reveal that while top-tier sales are holding, the broader market is still well below peak conditions.